
Are you struggling to see what your sales team actually does all day? In outbound manufacturing sales, high activity volume is the engine of your pipeline, but tracking it manually often leads to missed data and cold leads.
Understanding how HubSpot defines and logs sales activities is the first step toward moving away from gut-feel management and toward data-driven growth. When you track every touchpoint correctly, you can identify exactly where deals stall and which reps are your true high-performers.
What counts as a sales activity in HubSpot?
In the HubSpot ecosystem, an activity is any interaction a sales representative has with a prospect or customer. For B2B companies, especially those in traditional industries like manufacturing, these activities are the primary building blocks of a modern sales tech stack for manufacturers.
HubSpot categorizes activities into five core types that cover the vast majority of outbound sales work:
- Calls: Any outbound or inbound phone conversation, including dialer logs and transcripts.
- Emails: Individual sales emails sent through the CRM or a connected inbox, excluding marketing blasts.
- Meetings: Scheduled appointments, product demos, or technical consultations.
- Tasks: Actionable to-do items such as following up on a quote or sending technical specifications.
- Notes: Internal records of conversations, site visits, or prospect research.
By tracking these systematically, you can uncover the full narrative of a deal. For example, some firms have achieved a 15% reduction in sales cycle duration simply by interpreting sales performance data to identify and automate time-consuming administrative follow-ups.

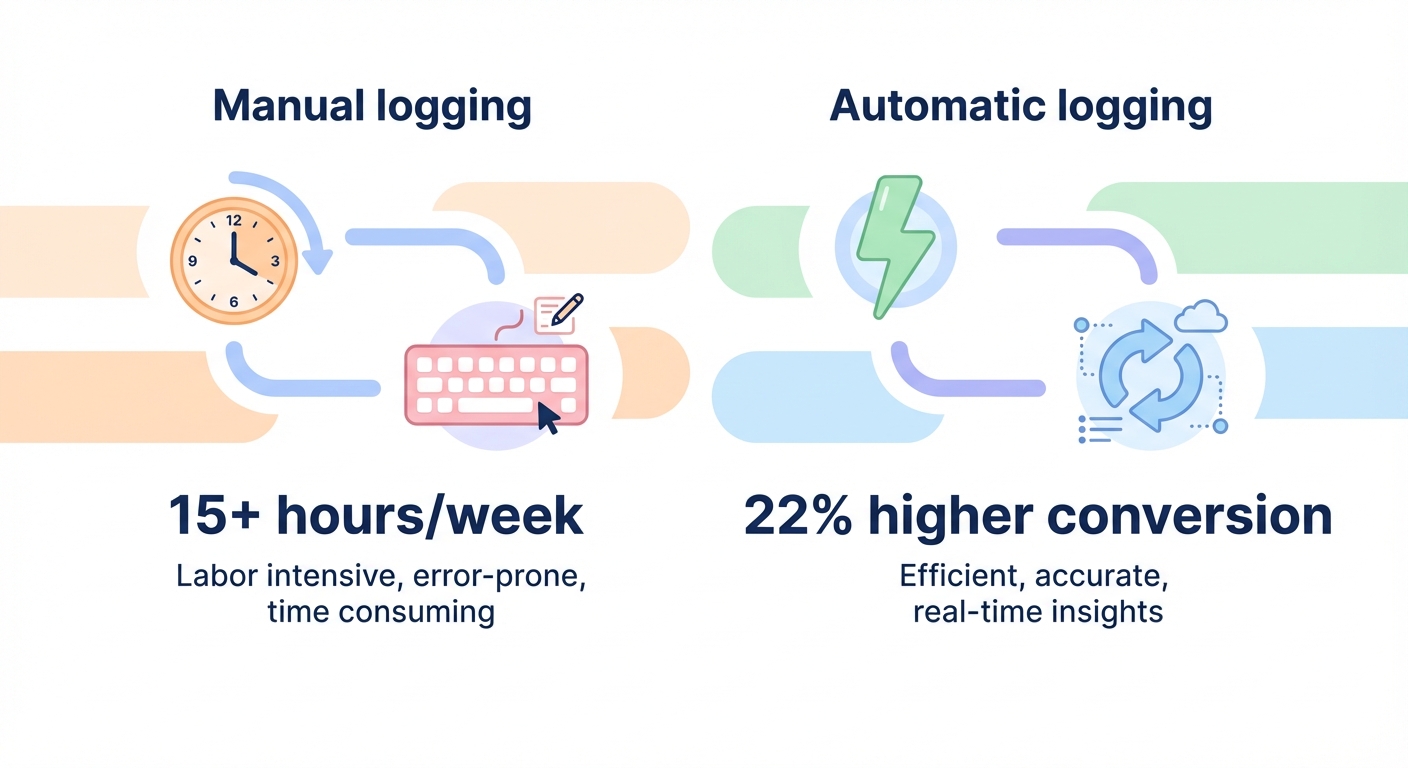
Manual vs. automatic logging: stop wasting time on data entry
If your reps spend hours at the end of every Friday manually typing in their call logs, you are losing money. Industry data suggests that manual data entry can consume over 15 hours per week per rep. HubSpot mitigates this through automatic logging tools that capture data as the work happens.
HubSpot Sales extensions for Outlook or Gmail automatically log every sent email while tracking opens and clicks in real-time. Similarly, calendar synchronization ensures that any meeting scheduled via Google or Outlook is automatically created as an activity record in the CRM. Connected phone systems or HubSpot’s native dialer further streamline this by logging call durations and outcomes without human intervention.
Manual logging remains necessary for offline moments, such as catching a prospect at a trade show or a quick hallway conversation. In these cases, reps should use the Log button on a contact record to ensure the touchpoint is captured. A UK manufacturing firm found that automating these routine tasks led to a 22% increase in conversion rates by freeing reps to focus on actual selling.
Key activity properties you need to track
Every activity in HubSpot contains specific properties – data points that provide the context needed for high-level reporting. For outbound teams, these properties are the “who, what, and when” of the sales process.
Critical properties include the activity date, which provides a timestamp of the interaction, and the activity owner, which assigns responsibility to a specific rep. The activity outcome is particularly vital for calls, as it tracks whether a rep connected, left a voicemail, or received no answer. Duration helps measure engagement, as longer meetings often correlate with higher prospect interest.
HubSpot also manages associations, linking activities to the relevant Contact, Company, and Deal records automatically. Ensuring this data remains clean requires proper CRM field mapping for manufacturers, which prevents information from becoming siloed or lost during system updates.
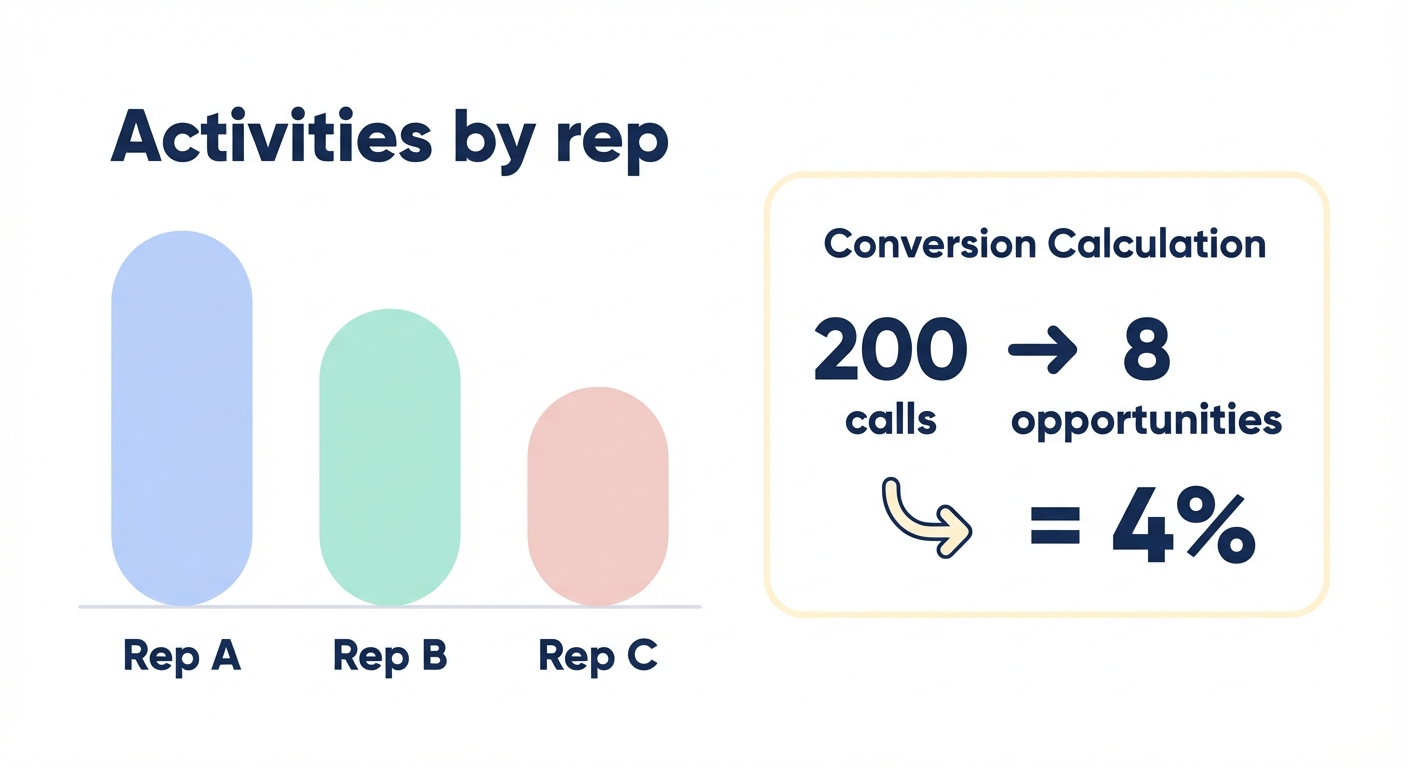
Building simple activity reports to track performance
Once your data is flowing into HubSpot, you can build dashboards that provide a clear view of team efficiency. A standard sales activity dashboard should move beyond simple volume and look at the quality of work being performed.
A bar chart showing total activities by rep can identify who is most active, while a line graph of activity trends helps you spot if the team is slowing down before a holiday or quarter-end. You should also monitor the call outcome distribution; if your “no answer” rate is exceptionally high, it may indicate that your team needs to adjust their outreach timing to better suit your industry’s schedule.
The most important metric for efficiency is the activity-to-opportunity conversion rate. For instance, if 200 calls generate 8 opportunities, your team has a 4% conversion rate. This level of reporting helps you avoid the common pitfall where hot leads go cold due to neglect. Implementing automating follow-up emails in sales workflows ensures that every logged activity has a clear, automated next step to keep the deal moving.
Reclaim your team’s selling time
Tracking activities in HubSpot gives you the visibility needed to manage an outbound team effectively. However, even with perfect tracking, your reps may still be bogged down by the research and grunt work required to find the right people to call.
Sera’s AI-powered Autopilot acts as a coordinated team of specialists to handle lead discovery and initial outreach for you. By automating the top of your funnel, you ensure that the activities logged in your HubSpot CRM are high-value conversations with decision-makers rather than a series of dead-end phone calls.
Ready to fill your HubSpot with more booked meetings and less administrative work? Discover how Sera’s AI agents can transform your outbound sales today.