
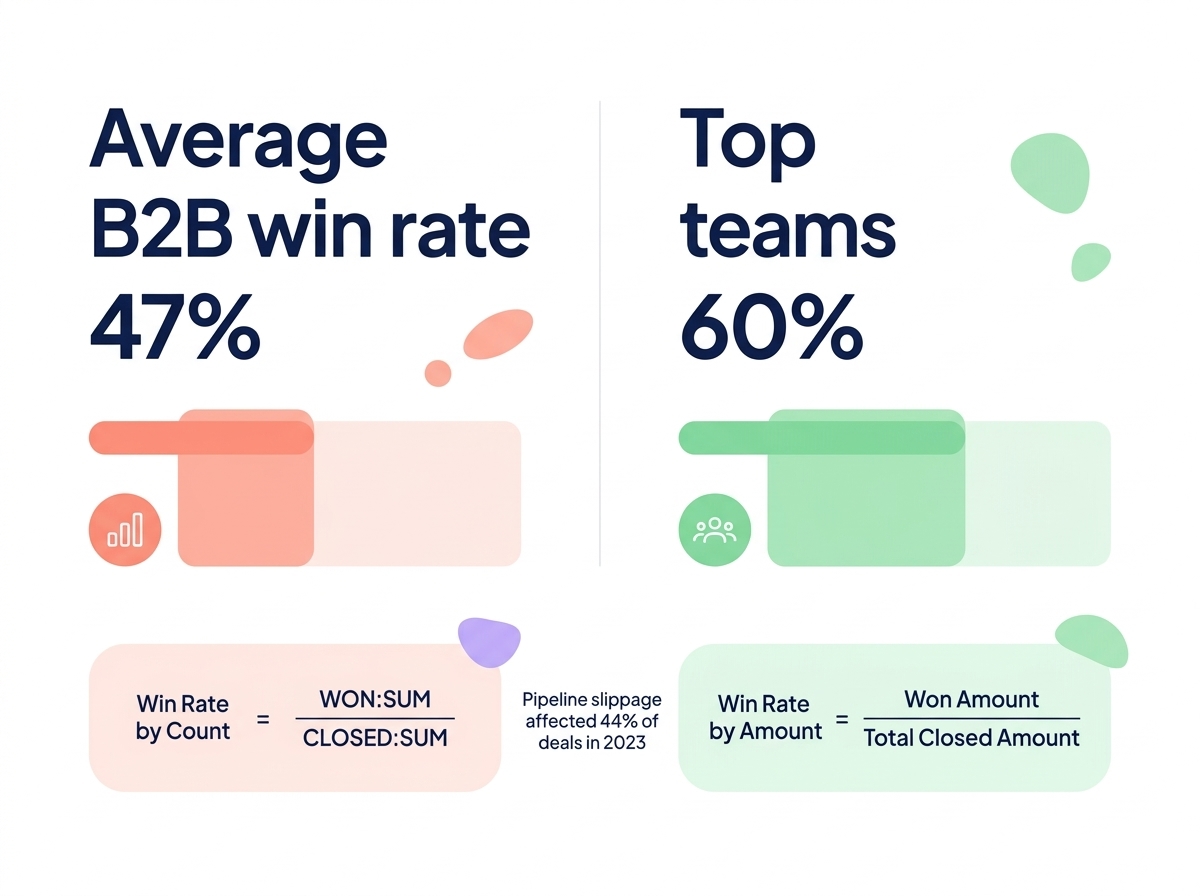
Are you tired of guessing why your manufacturing deals stall at the finish line? While the average B2B win rate is 47%, top-performing teams hit 60% by mastering win-loss reporting. Turning Salesforce data into actionable insights is the key to closing more high-value contracts.
Configuring custom fields for actionable deal data
While Salesforce tracks whether an opportunity is won or lost by default, it does not automatically record the specific reasons behind those outcomes. To move beyond guesswork, you must create a custom picklist field called “Loss Reason” within the Opportunity object. Think of this as a diagnostic tool for your sales machine. Without it, you cannot identify which parts of your process are failing or if your pricing is misaligned with the market.
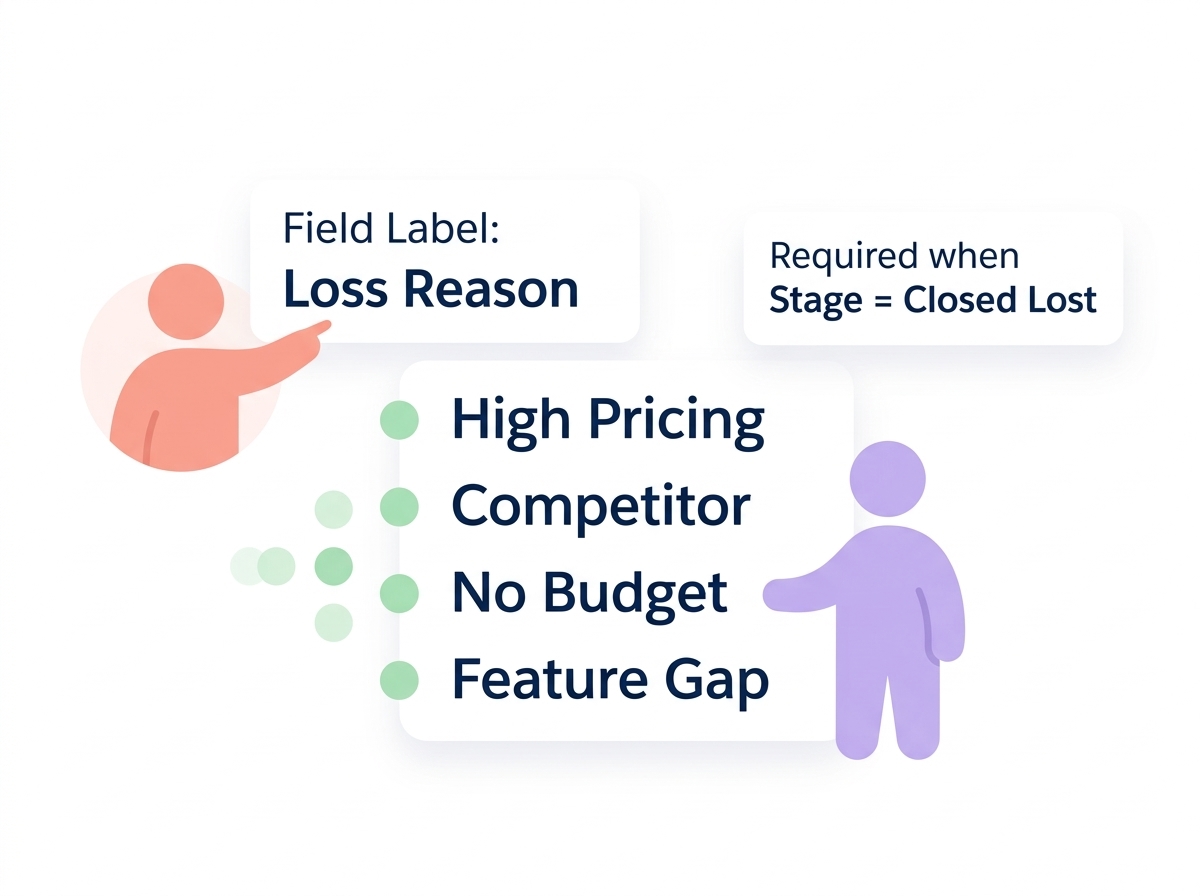
When setting up this field in the Object Manager, include specific values that provide clear data for your industry. Common reasons for deal failure in manufacturing often include high pricing, losses to specific competitors, a lack of budget, or a mismatch in product features. To ensure high data quality, configure your page layouts or validation rules to make this field mandatory whenever a rep moves an opportunity to the “Closed Lost” stage. This ensures your team captures the “why” while the details of the negotiation are still fresh.
Calculating win rates with summary formulas
You can measure your success through two primary lenses: the number of deals closed and the total revenue those deals represent. Calculating these figures within Salesforce reports allows you to see your performance at a glance without exporting data to spreadsheets. By interpreting sales performance data through both metrics, you gain a clearer picture of where your team excels and where they struggle.
Efficiency vs. revenue: count versus amount
- Win Rate by Count: This formula uses
WON:SUM / CLOSED:SUMto tell you how efficient your reps are at crossing the finish line. It is a pure measure of conversion regardless of the deal’s financial size. - Win Rate by Amount: This calculation divides the sum of won opportunity amounts by the total value of all closed opportunities. This is essential for understanding if you are winning your most valuable contracts or just the smaller, easier ones.
- Loss Rate: You can calculate this as
1 - Win Rate. Tracking this helps you identify “pipeline slippage,” which affected 44% of deals in 2023 and continues to erode forecast accuracy.
Building your win-loss dashboard
A single percentage rarely tells the whole story of your sales health. To truly understand your performance, you need real-time analytics dashboards that visualize trends and identify recurring patterns. Start by creating a report based on the “Opportunities” report type, filtering for all deals where the “IsClosed” status is true.
Effective dashboards usually include a trend line to show how win rates fluctuate month-over-month. You should also incorporate a donut chart to visualize loss reasons. If a large wedge of that chart is attributed to “Price” or “Feature Gap,” it provides the evidence needed to adjust your roadmap. Furthermore, grouping reports by opportunity owner can identify your most efficient closers, while breaking down win rates by industry allows you to see which sectors are most receptive to your product.
Addressing the data quality pitfalls
Data is only as useful as its accuracy. Poor data quality costs companies an average of $12.9 million to $14 million per year. In the context of a Salesforce lead generation process, issues like duplicate opportunities, inconsistent stage definitions, and blank “Amount” fields can completely skew your win-loss metrics. Fixing these issues can boost forecast accuracy by as much as 42%.
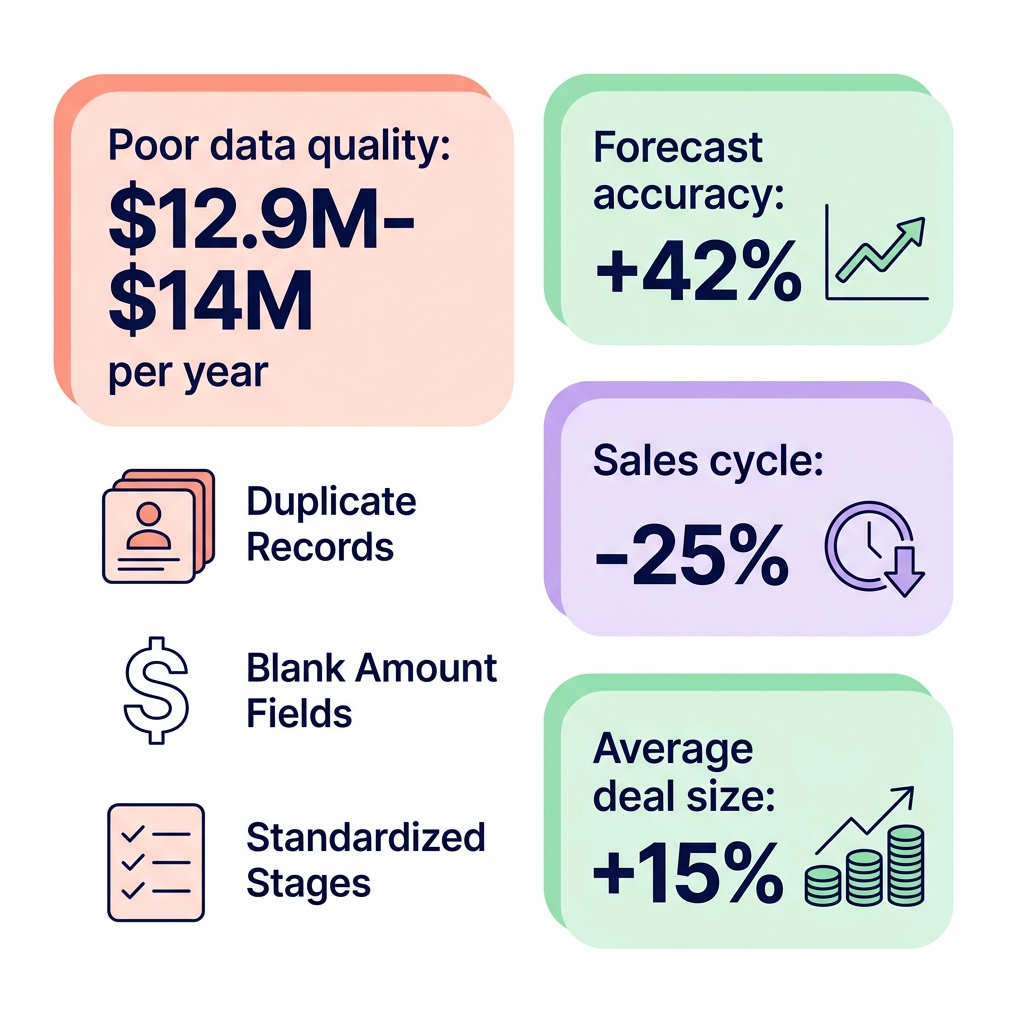
To maintain a clean system, you should implement duplicate matching rules and appoint a data champion to oversee hygiene. Standardizing your sales stages ensures that every rep follows the same definitions, preventing “stalled” deals from inflating your pipeline numbers. When your data is clean, win-loss analysis can shorten sales cycles by 25% and increase average deal sizes by 15%, as reps spend less time on bad-fit prospects and more on high-probability opportunities.
Driving higher win rates with research-driven outreach
When win-loss analysis reveals a high frequency of “poor fit” outcomes, the root cause is often at the top of the funnel. Even the most talented sales team will struggle to close deals if they are chasing the wrong prospects. In the manufacturing sector, where the average sales cycle is 136 days and can reach 18 months, wasting time on low-intent leads is incredibly costly.
Sera helps you solve this by filling your Salesforce lead funnel with high-quality, research-backed opportunities. Sera’s Autopilot uses six specialist AI agents to handle the heavy lifting of list building, enrichment, and outreach. Instead of guessing, you can automate prospect scoring to ensure your reps only engage with decision-makers who match your ideal customer profile. This level of precision ensures that your Salesforce reports reflect a pipeline of deals you are actually equipped to win.
Mastering Salesforce win-loss reports transforms raw opportunity data into a strategic map for your sales team. By combining these insights with high-quality, AI-driven outreach, you can stop chasing every lead and start focusing on the contracts that drive growth.
Discover how Sera’s AI agents can automate your outreach and grow your revenue.