
Does your sales data feel like a collection of random numbers rather than a clear roadmap? Most manufacturing leaders struggle to identify which activities actually drive revenue in complex, multi-stakeholder deals. Improving your data interpretation helps you fix bottlenecks before they impact your production schedule.
Critical sales metrics for the manufacturing sector
Manufacturing sales cycles are fundamentally different from typical B2B software environments. You are managing technical evaluations, long-term relationship building, and high-value orders that require multiple layers of approval. To understand your performance truly, you must look beyond total revenue and monitor specific benchmarks tailored to industrial sales.
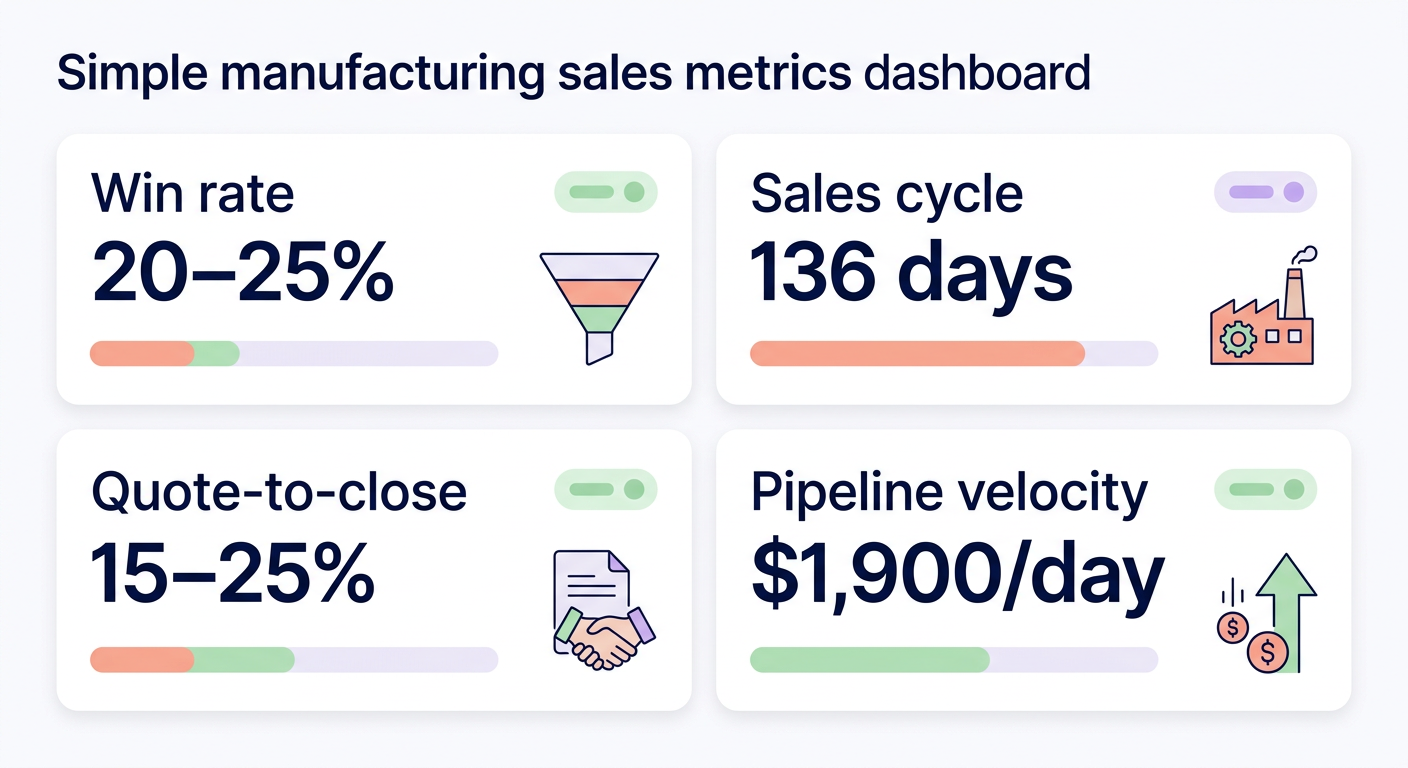
- Win rate: The industry average for manufacturing is approximately 20-25%. If your win rate falls below 20%, it often indicates that your top-of-funnel lead quality is weak or your technical qualification process is failing. Many high-performing teams use a Salesforce win-loss analysis to identify exactly where they are losing ground to competitors.
- Sales cycle length: The average manufacturing cycle lasts 136 days, which is nearly double the average for SaaS companies. Large industrial deals can even extend from 6 to 18 months. Organizations improving sales outcomes with analytics can often shorten this cycle by as much as 25% by identifying and removing friction points.
- Quote-to-close rate: A healthy benchmark for industrial firms typically sits between 15% and 25%. If your rate is lower, it signals potential issues with your pricing models, quote accuracy, or the technical approval process.
- Pipeline velocity: This metric measures how much revenue moves through your funnel every day. While manufacturing averages roughly $1,900 per day – which is lower than some other sectors – it reflects the longer cycles inherent in heavy industry.
Why manufacturing leaders misread sales data
Data is only useful if it is accurate and contextualized. Many established firms fall into “data traps” that lead to skewed perceptions of performance and poor decision-making.
The silo problem
In many manufacturing organizations, data is trapped in separate departments. Production, finance, and sales often use disconnected systems, making it nearly impossible to see the holistic impact of prospect data on sales strategy. This fragmentation prevents leadership from seeing which marketing efforts or engineering consultations actually lead to a signed contract.
Relying on lagging indicators
Only tracking closed deals is like trying to drive a truck while looking exclusively in the rearview mirror. You need leading indicators, such as weekly pipeline velocity, to predict future revenue accurately. Research indicates that companies tracking velocity on a weekly basis achieve 87% forecast accuracy, compared to a mere 52% for those who check it irregularly.

The SaaS comparison trap
It is a mistake to measure an industrial business against software standards. A 20% win rate and a six-month cycle are perfectly normal in manufacturing. Treating these benchmarks as “failures” because they do not match SaaS metrics can lead to knee-jerk changes that disrupt your sales team’s morale and long-term relationship-building efforts.
Analytics strategies to improve outcomes
Once you have established clean data sources, you can apply specific frameworks to boost your results. Extracting actionable insights from prospect data allows your representatives to stop guessing and start focusing on the deals with the highest probability of closing.
Predictive lead scoring
Instead of chasing every lead that comes through the door, use AI to rank them by potential. Using predictive scores to forecast sales outcomes allows you to prioritize high-value accounts based on their behavior, such as a prospect visiting your technical specification pages multiple times in a single week.
Activity tracking
In a long sales cycle, maintaining consistent momentum is vital. Monitoring HubSpot sales activities ensures that your reps are following up at the right intervals. Speed is particularly important even in industrial sales; leads contacted within one hour are seven times more likely to convert than those who receive a response after 24 hours.
Technical sales engineering
Manufacturing deals frequently require deep expert input to cross the finish line. Sales teams that utilize dedicated technical sales engineers achieve 35% higher win rates on complex deals. Using data to identify which opportunities require technical intervention early in the cycle can save your team weeks of wasted effort on unqualified leads.
The role of AI in manufacturing sales
Currently, only 18% of manufacturing teams use AI tools, which is significantly below the B2B average. This represents a massive competitive opportunity for early adopters. AI is not just for tech companies; it can reduce administrative CRM tasks by 45%, giving your reps more time to visit plant floors and build the trust required for high-stakes contracts.

Modern AI tools for sales performance tracking can automate the most tedious parts of the process. For example, Sera’s AI agents handle the heavy lifting of list building, firmographic enrichment, and initial outreach. This ensures your data remains clean from the very first touchpoint, following the best practices for prospect data interpretation.
By moving from gut feelings to data-driven reviews, you can better navigate the 131 million new consumers entering the global market by 2025. Consistent weekly reviews and unified data sources are the foundation of modern manufacturing growth.
To see how AI-driven outreach can fill your pipeline with higher-quality data and qualified meetings, learn more about Sera’s Autopilot.