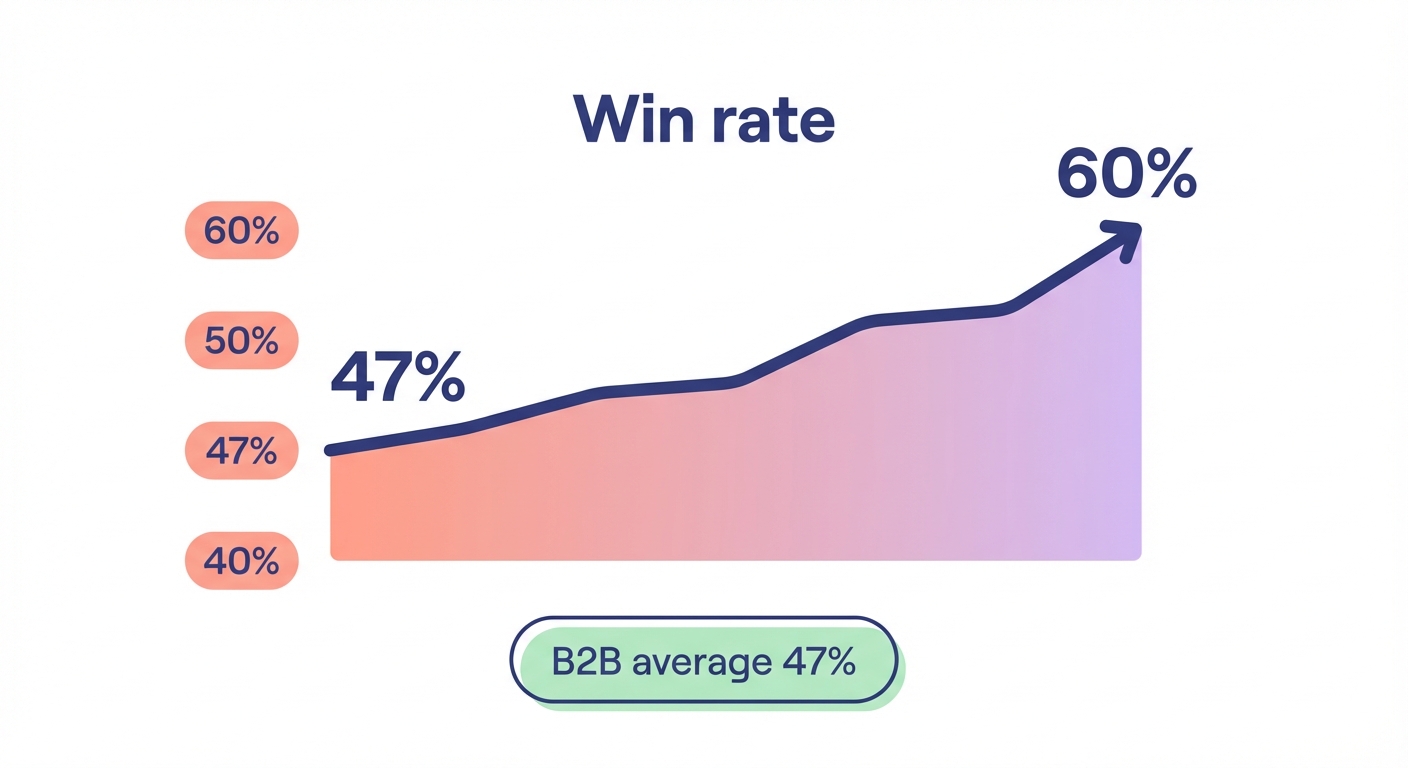
Skip to content

How to build win-loss and win rate reports in Salesforce

Taavid Mikomägi
Taavid Mikomägi
Head of Growth

Your Salesforce opportunity data holds the answers to why deals close – or don’t. But most sales teams only scratch the surface.

Win-loss reports transform your CRM from a record-keeping system into a strategic tool. When properly configured, these reports reveal patterns that predict revenue: which deal types convert fastest, where your pipeline stalls, and what separates your 47% industry-average win rate from the 60%+ that top performers achieve.

Why accurate win-loss tracking matters for your bottom line

The average win rate across industries hovers around 47%. Top-performing sales teams using structured win-loss analysis achieve win rates above 60%.

That 13-point difference translates to millions in revenue. A UK SaaS company implemented Salesforce win-loss analysis, identified that 30% of lost deals were due to a specific feature gap, and boosted their win rate by 15% within six months.

But here’s what most sales ops teams miss: win rate analysis only works when your data is clean. A UK technology firm discovered 15% of their “lost” deals were incorrectly flagged when they were still in negotiation. Their reports were steering strategy in the wrong direction.

Consistent stage marking in Salesforce – particularly the final “Closed Won” or “Closed Lost” status – is the foundation. Without it, your analytics algorithms are learning from noise, not signal. This discipline becomes even more critical when you integrate AI-driven tools into your CRM to automate insights and actions.

The correct win rate formula for Salesforce reports

Win rate measures the percentage of opportunities you close successfully. The standard formula in Salesforce reports is straightforward:

WON:SUM / CLOSED:SUM

This divides the number of won opportunities by the total number of closed opportunities (won + lost), then expresses the result as a percentage.

You can calculate win rate by count (how many opportunities) or by amount (total deal value):

  • Win rate by count: Number of Closed Won opportunities ÷ Total Closed opportunities
  • Win rate by amount: Total value of Closed Won ÷ (Total value of Closed Won + Total value of Closed Lost)

The by-amount calculation reveals whether you’re winning your larger deals or just high volumes of small ones – a crucial distinction for B2B manufacturers where enterprise accounts drive the majority of revenue.

Loss rate follows the same logic: (CLOSED:SUM - WON:SUM) / CLOSED:SUM

Here’s an example from a real implementation: a sales team closed 100 opportunities in Q3. 62 were won, 38 were lost. Their win rate by count: 62%. Their loss rate: 38%. But when calculated by amount, their win rate dropped to 55% because larger deals were closing at lower rates than smaller ones. That insight prompted an immediate shift in enterprise account strategy.

Step-by-step setup: Building your first win-loss report

Create the base opportunity report

Navigate to Reports > New Report > Opportunities. This is your starting point.

Filter your report to show only Closed opportunities. This is critical – open opportunities skew your metrics. Set the filter: Stage equals “Closed Won” OR Stage equals “Closed Lost.”

If your org uses custom stage names, adjust accordingly. The key is filtering to opportunities that have reached a final outcome.

Configure the win rate formula field

In the report builder, add a summary formula. Name it “Win Rate.”

Use this formula:

WON:SUM / CLOSED:SUM

Set the format to Percent with one or two decimal places.

Add a second formula for “Loss Rate”:

(CLOSED:SUM - WON:SUM) / CLOSED:SUM

These formulas use Salesforce’s built-in summary functions. WON:SUM counts opportunities where Stage = “Closed Won.” CLOSED:SUM counts all closed opportunities regardless of outcome.

Add meaningful groupings

Group your report by dimensions that matter for your sales process:

  • Opportunity Owner (which reps are closing deals?)
  • Close Date (monthly, quarterly, or yearly trends)
  • Opportunity Type (new business vs existing customer)
  • Industry or Product Line (segment performance)

For example, group by Opportunity Owner and Close Date (grouped by Month). This shows you each rep’s monthly win rate trend – revealing who’s improving and who needs coaching.

You can combine these reports with predictive analytics to forecast sales outcomes and identify patterns before deals close.

Configure date filters

Set the date range to match your reporting period. For monthly analysis, filter to “Close Date = THIS MONTH.” For trend analysis, expand to “Close Date = LAST 12 MONTHS” and group by month.

Here’s a pro tip from a Bristol technology firm: “We spent three days mapping our data fields properly at the beginning, which saved us three months of troubleshooting later.” The same applies to date ranges – align them to your business calendar (fiscal year, quarters, seasonal patterns) from day one.

Add custom fields for loss reasons

Standard Salesforce tracks whether you won or lost. It doesn’t track why. Create a picklist field called “Loss Reason” with values that matter to your business:

  • Price too high
  • Lost to competitor (specify which)
  • No budget
  • Feature gap
  • Timing not right
  • Poor fit
  • No decision made

Make this field required when Stage = “Closed Lost.” This forces reps to document the reason at close, creating data that drives better sales outcomes with analytics.

Add Loss Reason as a grouping in your report. Now you can see: “35% of lost deals were due to pricing, but only 18% of deals over £50k cite price as the reason.” That’s actionable intelligence.

Building a win-loss dashboard that actually gets used

Reports are great. Dashboards are better. They update in real-time and sit where your team already works.

Decision-Maker Identifier blob character with a globe badge saying win-loss dashboards turn raw Salesforce data into daily decisions.

Create a new dashboard

Navigate to Dashboards > New Dashboard. Name it “Sales Win-Loss Analysis.”

Set the running user to yourself (for testing) or to a role that has visibility into all opportunities (for shared dashboards).

Add your core components

Component 1: Overall win rate gauge

Add a gauge chart showing current quarter win rate. Set the range from 0-100%, with a target line at 60% (or your benchmark). This gives leadership an instant health check.

Component 2: Win rate by rep table

Add a table component using your win-loss report grouped by Opportunity Owner. Display columns: Owner Name, Total Closed, Closed Won, Win Rate, Total Value Won.

Sort by Win Rate descending. This creates healthy competition and spots coaching opportunities immediately. Well-trained sales teams achieve up to 52% better adoption and ROI from sales technology investments according to Salesforce data.

Component 3: Win rate trend line chart

Add a line chart showing win rate by month over the last 12 months. This reveals seasonality and the impact of changes (new product launches, pricing adjustments, sales training).

Component 4: Loss reason donut chart

Add a donut chart grouping by Loss Reason. Size slices by count or amount. This visualizes where deals are leaking out of your pipeline.

A UK SaaS company using this exact dashboard component discovered that “feature gap” losses spiked immediately after a competitor launched a new module. They fast-tracked their own development and recovered market share within two quarters.

Set refresh schedules

Configure your dashboard to refresh daily at 6:00 AM. This ensures the data is current when your team starts their day.

For high-velocity sales environments, consider hourly refreshes during business hours.

Advanced analysis: Segment your win rates by customer type

Here’s where win-loss analysis becomes strategic. Not all opportunities are created equal.

A sales team with a 62% overall win rate might see:

  • 87% win rate with net new logos
  • 55% win rate with existing customers (renewals, upsells)

That’s the opposite of what most B2B manufacturers expect. It suggests a customer success problem – satisfied customers should be easier to upsell than cold prospects are to close.

Create separate reports for:

  • New business (net new accounts)
  • Expansion (existing accounts, larger deals)
  • Renewal (subscription or contract renewals)

Group by product line, industry, region, and deal size bands (0-10k, 10-50k, 50k+).

This multi-dimensional view reveals patterns like: “We win 78% of deals under £25k but only 41% over £100k” or “Our win rate in manufacturing is 15 points higher than in retail.”

Now you can allocate resources intelligently. Double down on what’s working. Fix what’s broken. Understanding how buyers research suppliers can help you tailor your approach for different customer segments.

Integrate win-loss data with your broader sales process

Win-loss reports don’t live in isolation. Connect them to the rest of your sales stack.

Enable Opportunity History Tracking (Setup > Object Manager > Opportunity > Fields & Relationships > Set History Tracking). Track changes to Stage, Amount, Close Date, and Loss Reason.

This creates a time-stamped audit trail. You can analyze how long opportunities spend in each stage before winning or losing. A UK SaaS company cut their sales cycle by 25% by identifying that opportunities spending more than 14 days in “Proposal” stage had a 40% lower close rate. They implemented a 10-day proposal deadline and saw immediate improvement.

Combine with sales velocity metrics

Sales velocity is calculated as (Number of opportunities × Average deal value × Win rate) ÷ Sales cycle length.

Your win rate directly impacts velocity. A 10-point increase in win rate can accelerate revenue growth by 15-20% without adding more leads.

Track these metrics side-by-side on your dashboard. When win rate rises but velocity stays flat, you know cycle time or deal size is the bottleneck. Learn more about interpreting sales performance data to understand the relationships between these metrics.

Feed insights back to marketing and demand generation

Your win-loss data should inform lead generation strategy. If you win 65% of deals from inbound demo requests but only 35% from purchased lists, that’s a massive signal about where to allocate budget.

Enrichment Agent blob character with a stacked-database icon saying share win-loss insights with marketing and AI tools to optimize your funnel.

Share a monthly win-loss summary with marketing. Include top loss reasons, win rate by lead source, and messaging that resonates (pulled from won deals’ notes).

One UK manufacturing firm used this feedback loop to shift 40% of their lead gen budget from trade shows to technical content marketing. Their cost per qualified lead dropped 28% and win rates on those leads increased because prospects were better educated before the first call. Building a structured Salesforce lead funnel ensures these insights flow smoothly between teams.

Common mistakes that sabotage win-loss analysis

Mixing open and closed opportunities

If your report includes “Negotiation” or “Proposal” stage opportunities alongside “Closed Won” and “Closed Lost,” your win rate will be artificially deflated. Always filter to closed opportunities only.

Not standardizing close dates

Sales reps who backdate close dates to hit quarterly quotas poison your trend analysis. Enforce a policy: Close Date must be within 7 days of when Stage changes to Closed Won/Lost.

Ignoring small sample sizes

A rep with 3 closed deals and 2 wins has a 67% win rate. A rep with 40 closed deals and 26 wins has a 65% win rate. They’re not equivalent. Set a minimum threshold (e.g., 10 closed deals) before highlighting win rates in dashboards.

Letting loss reasons become garbage data

If reps can select “Other” or leave Loss Reason blank, they will. Make it required. Review the list quarterly and add new reasons that emerge from deal reviews. Remove options that never get selected.

Not acting on the insights

The point of win-loss analysis isn’t the report – it’s the decisions you make from it. Schedule a monthly pipeline review where the team discusses: What’s our win rate trend? What’s the top loss reason this month? What are we doing about it?

A Cambridge sales team using this discipline boosted their win rate from 44% to 58% over eight months by systematically addressing their top two loss reasons each quarter.

Take your Salesforce analytics to the next level

Win-loss reporting is foundational, but it’s just the beginning. Top-performing sales teams layer in AI-driven prospect insights, metrics for evaluating AI-driven lead quality, and automated workflows that act on these insights in real-time.

When you combine clean win-loss data with intelligent automation, you create a system that learns which opportunities to pursue, which messaging converts, and when to engage – before your competitors even know the account is in play. UK companies measuring integration ROI are 2.5x more likely to achieve expected returns because measurement drives continuous optimization.

Manufacturers across Europe are using this approach to open new markets, improve proposal acceptance rates, and cut sales cycles. Modern AI-powered sales automation tools can reduce lead qualification time by 30-50%, allowing sales teams to focus on high-potential opportunities. The data is in your CRM. The reports are straightforward to build. What matters now is turning analysis into action.

Ready to transform your sales process with AI that actually understands your pipeline? Explore how Sera can automate lead generation and qualification while you focus on closing the deals your Salesforce data says you should win.